B2B Ed-tech Industry 240% lead growth Using Digital Marketing
How a data-driven channel pivot transformed a Laboratory Supplies & Furniture brand from stagnant lead flow to its most successful growth year on record.
Client
Duration
3 Financial Years
(FY23–26)
Channels
Google, Meta & LinkedIn Ads
Geography
Pan India 🇮🇳
Results that speak for themselves
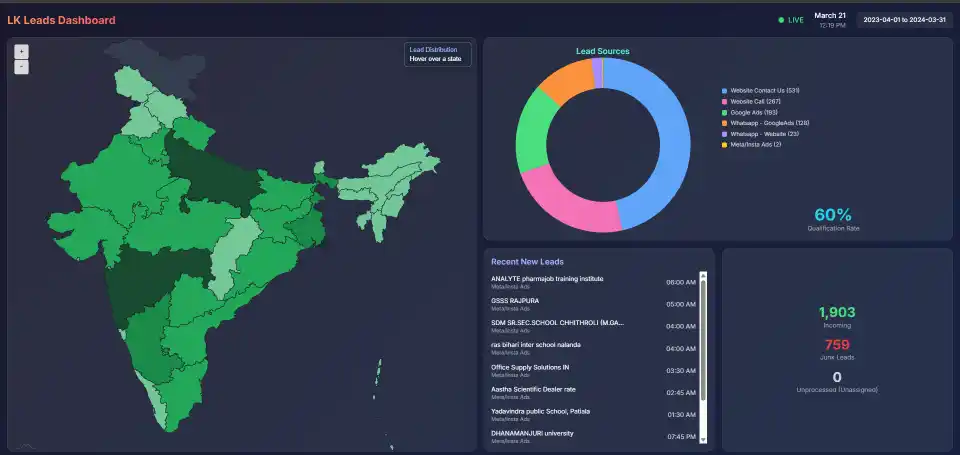
1,903 Leads
60% qualification rate
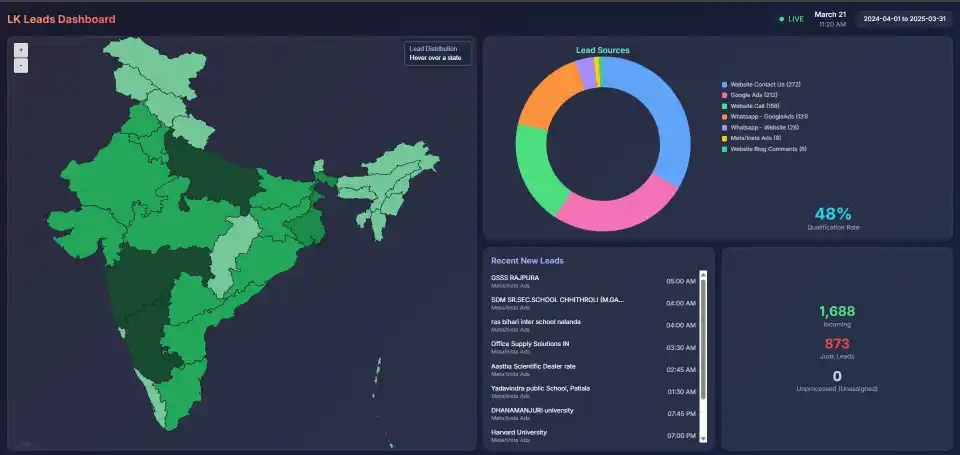
1,688 Leads
48% qualification rate
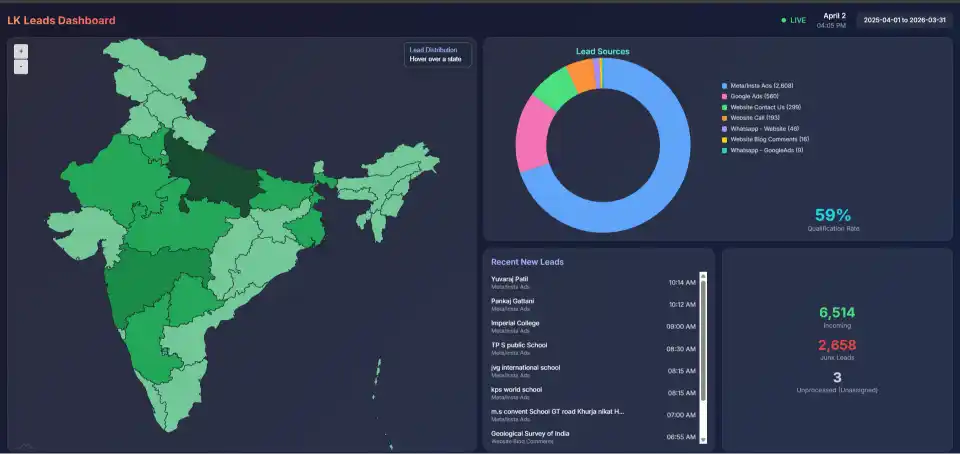
6,514 Leads
59% qualification rate
The Challenge
A brand relying on the wrong channels
When we started, the lead pipeline was thin, conversion tracking was broken, and Meta was barely being used.
Stagnant lead volume
In FY24, incoming leads were 1,903 — already low for a national B2B brand. By FY25, this had dropped a further 11% to 1,688, with qualification rate falling sharply from 60% to 48%.
Misattributed Google performance
Google Ads was reporting 239,000 "conversions" — but these were micro-events: page views, video views, scroll depth. Actual lead counts from Google were just 212. The account was optimising for the wrong objective entirely.
Meta was untapped
Meta/Instagram Ads had a total budget of ₹9,413 across FY25 — less than a day's budget for a serious campaign. Only 8 leads were tracked. The channel's B2B lead potential was completely unexplored.
No lead quality framework
Junk leads were consuming sales team bandwidth. With a 52% junk rate in FY25, more than half of every rupee spent on ads was generating noise, not pipeline.
The Strategy
The approach wasn't about spending more — it was about spending smarter and rebuilding from the ground up.
Fixed conversion tracking on Google
Stripped out all micro-event conversions and reconfigured campaigns to optimise only for qualified lead form submissions. This alone revealed the true picture — Google Ads was generating real leads, just uncounted.
Activated Meta as a lead gen engine
Moved Meta from a brand awareness play to a full lead generation channel — deploying Instant Forms, audience segmentation by institution type (schools, colleges, labs), and creative testing at scale.
Creative strategy built around pain points
Top-performing ads answered real buyer questions: "How much will a new science lab cost?" and "Build Science Labs with Labkafe." These led to ₹21–28 CPL — the strongest ROI in the entire account.
Budget reallocation — scale what works
Google spend was cut 40% and redistributed to Meta where CPL was demonstrably lower. The result: 20× more Meta spend, 10× more reach, and a category-leading cost per qualified lead.
Quality signals embedded in campaigns
Audience exclusions, negative keyword hygiene, and form qualification questions were introduced to reduce junk leads — bringing the rate back from 52% to 41% despite 3.9× more volume.
Google Ads Performance
Spend cut by 40%, fixed conversion tracking, cost-per-conversion improved sharply
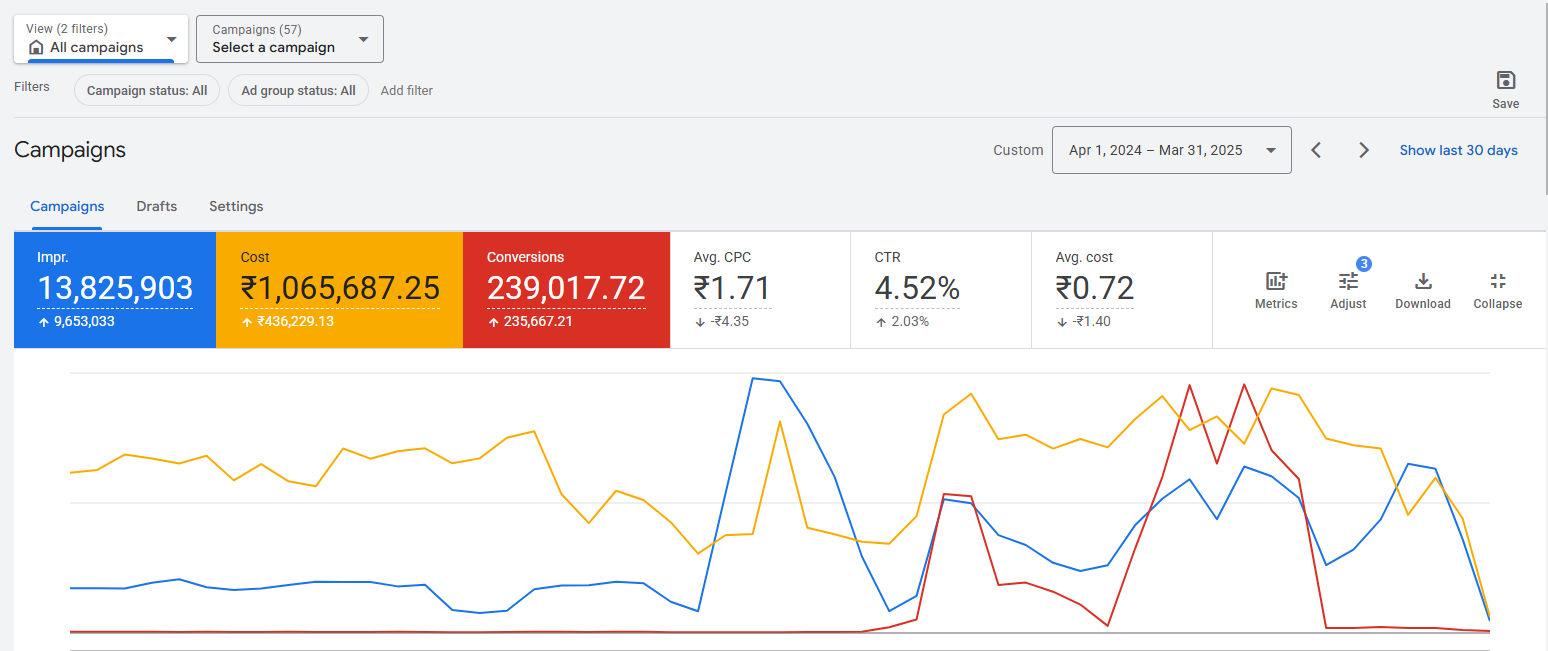
₹0.72 CPL
Unfixed conversion tracking, brand awareness focus
Key Metric
239,000 reported "conversions" (mostly micro-events)
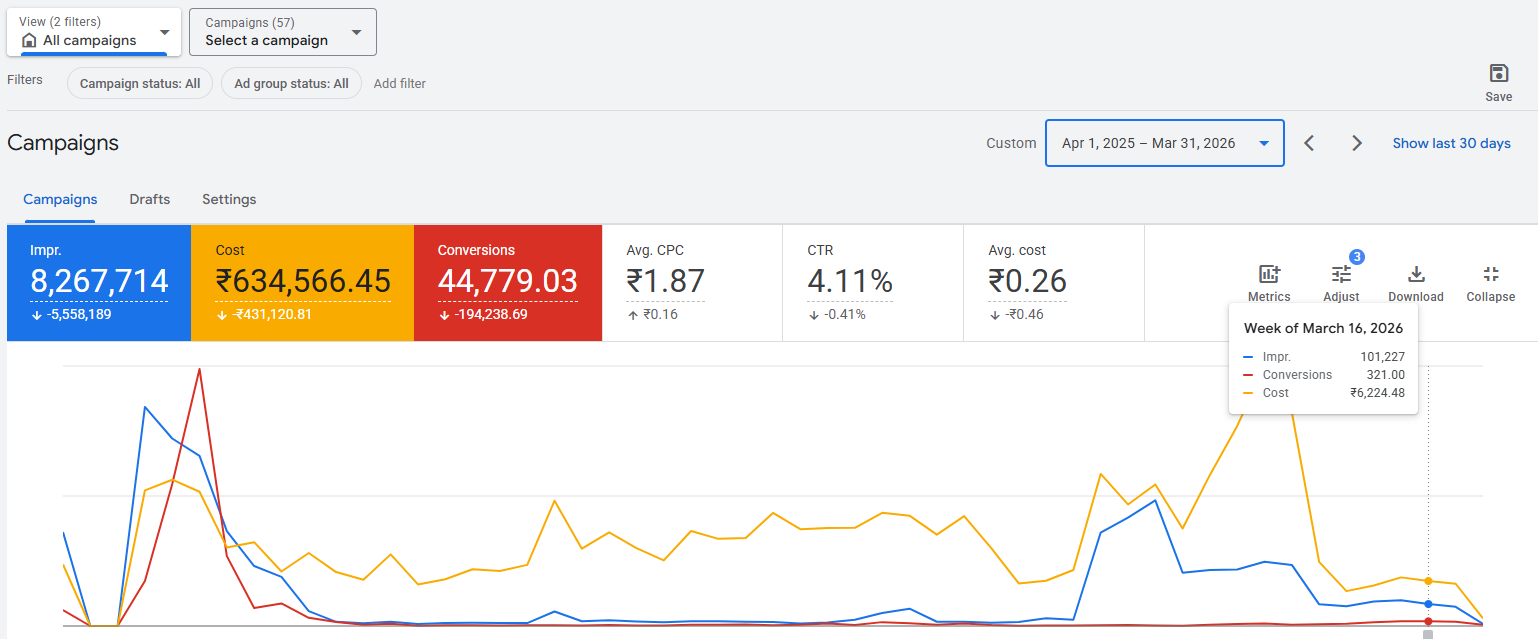
₹0.26 CPL
Fixed tracking, funnel-optimized lead generation
Key Metric
64% reduction in cost-per-conversion
Strategic Shift: From Brand Awareness to Funnel Optimization
Actions Taken
- ✓ Removed micro-event conversions (page views, video views, scroll depth)
- ✓ Optimized campaigns for qualified lead form submissions only
- ✓ Reduced spend by 40% — reallocated to Meta
- ✓ Sharpened targeting to high-intent institutions
Results Achieved
- → 64% reduction in cost per conversion
- → True lead count revealed — conversion tracking now accurate
- → Freed budget enabled Meta scaling to 20× previous spend
- → Cleaner funnel, better sales team efficiency
Meta Ads Performance
From brand awareness experiment to primary growth engine — 20× budget scaling with AI-optimized performance
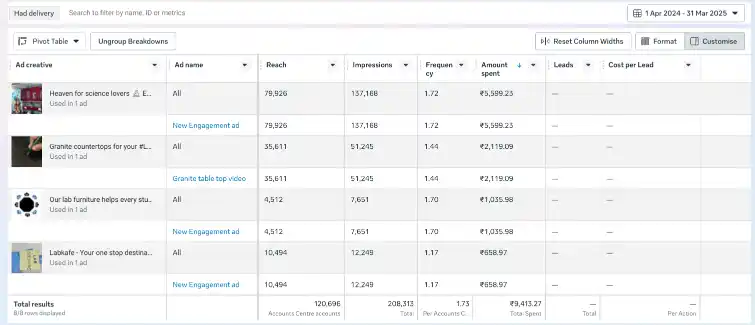
₹9,413 spend
Brand awareness experiment, no lead tracking
Key Metric
8 leads tracked (minimal presence)
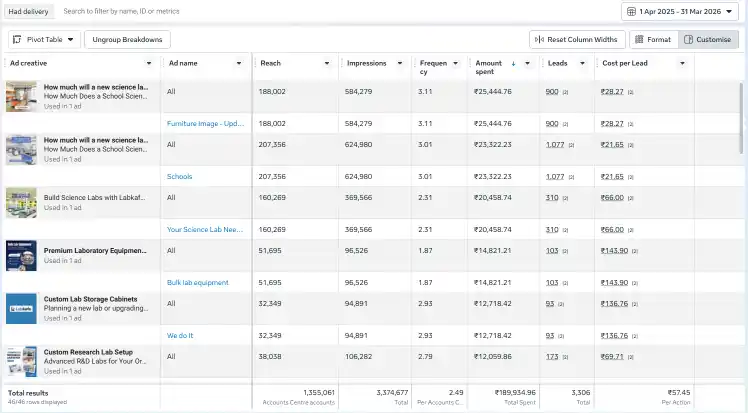
₹1,90,000 spend
Primary growth engine with AI optimization
Key Metrics
3,306 leads at ₹57/lead
AI-Powered Transformation: From Experiment to Engine
AI Implementations
- ✓ Meta AI for creative audience matching and lookalike expansion
- ✓ Automated bid optimization using performance data signals
- ✓ AI-driven ad copy testing and creative iteration
- ✓ Dynamic budget allocation across campaigns in real-time
Results Achieved
- → 20× budget increase — ₹9.4K to ₹1.9L
- → 3,306 qualified leads generated
- → ₹57 CPL — most efficient lead cost across all channels
- → Meta now primary driver of pipeline growth
Ready to grow your business?
Let's talk about what a data-driven digital strategy can do for your brand. No fluff — just results.
WhatsApp Now